

BÍ QUYẾT LUYỆN THI IELTS WRITING TASK 1 (PHẦN 2)
BÍ QUYẾT LUYỆN THI IELTS WRITING
Bar Chart là một trong những dạng biểu đồ thường gặp trong IELTS Writing Task 1. So với các dạng biểu đồ khác, Bar Chart dễ phân tích hơn. Dù vậy, bạn vẫn nên chú ý đến một số đặc trưng cơ bản của dạng biểu đồ này và xử lý các số liệu một cách thông minh để bài tăng điểm cho bài viết. Hãy cùng ISEC tìm hiểu về dạng biểu đồ này nhé.
IELTS WRITING TASK 1
BÍ QUYẾT LUYỆN THI IELTS WRITING TASK 1 (PHẦN 2)
BAR CHART
1. Định nghĩa
Bar chart hay còn gọi là Bar Graph là dạng biểu đồ sử dụng những thanh đứng hoặc nằm ngang để biểu thị số liệu và sự so sánh giữa một số mục. Một trục của biểu đồ dùng để biểu thị các hạng mục so sánh, trục còn lại biểu thị các nấc giá trị (số liệu) riêng biệt.
Dàn bài chung sẽ bao gồm : Introduction (mở bài), Overview (tổng quan), Body (thân bài 1&2 ).
2. Một số cấu trúc và từ vựng
2.1.Từ vựng
|
CHỈ SỰ GIỐNG NHAU |
CHỈ SỰ KHÁC NHAU |
|
|
Tính từ, trạng từ |
Similarly, Similar, likewise |
Opposite, reverse, contrasting. On the other hand, in contrast. |
|
Liên từ |
As well as, Just as, similar to |
While/whereas Compared with/In Comparison with/In Contrast to/As opposed to |
2.2. Cấu trúc
* So sánh hơn
|
CẤU TRÚC |
VÍ DỤ |
|
A it (just/well/nearly)+under/over + x+ larger/smaller than B |
-In 2001, rice consumption in China was just under 10% larger than Vietnam’s. - China was nearly 10 times more populous than Canada in 1999 |
|
-A produces/…+ (slightly/considerably) +more/less(fewer) +n than B |
-Vietnam produced considerably less rice than Thailand in 2010 |
* So sánh nhất
|
CẤU TRÚC |
VÍ DỤ |
|
-A is the (second/third) largest/smallest/most productive/… than B |
-Vietnam was the second largest rice producer in Asian |
|
-A produces/…+the largest/smallest +proportion + of count n/ noncount n -A produces/…+the largest/smallest +amount + of non count n -A produces/…+the largest/smallest +quantity + of count n -A produces/…+the largest/smallest +number + of count n |
-Compared with other countries in the region, the USA consumed the largest proportion of fast food - Compared with other countries in the region, Vietnam produced the smallest number of computer, with only 100 computers circulated in the domestic market in 2010. |
3. Cách làm bài Bar chart
3.1 Introduction
Viết lại đề bài sử dụng các synonyms và paraphrases bằng cách thay đổi từ vựng, thay đổi cấu trúc câu hoặc đảo vị trí, tùy vào khả năng của các bạn và đề bài.
Ví dụ :
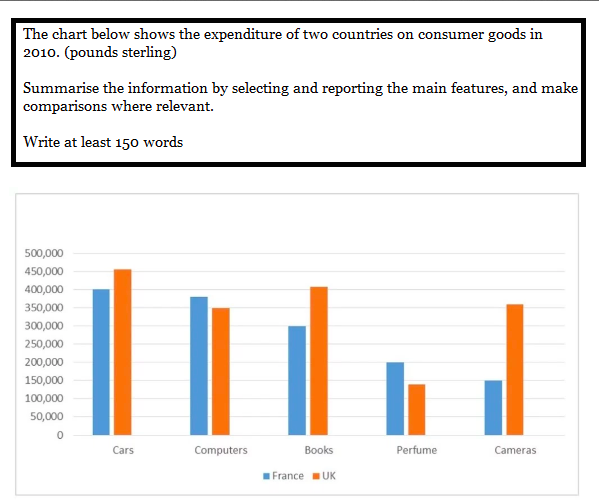
“The bar chart illustrates the amount of money spent on five consumer goods (car, computers, books, perfume and cameras) in France and the UK in 2010. Units are measured in pounds sterling.”
The chart = The bar chart
shows = illustrates
The expenditure of two countries on consumer goods = the amount of money spent on five consumer goods (car, computers, books, perfume and cameras) in France and the UK
(pounds sterling) = Units are measured in pounds sterling.
3.2 .Overview
Các giám khảo sẽ đánh giá cao nếu như các bạn có thể đưa ra 2 đặc điểm nổi bật. Những đặc điểm nổi bật này thì có thể là số liệu cao nhất, thấp nhất hoặc giữ cân bằng trong một thời gian dài, …
Ví dụ :
The bar chart shows the global sales (in billions of dollars) of different types of digital games between 2000 and 2006
Nhìn vào biểu đồ chúng ta thấy điểm nổi bật là:
– Các cột đều tăng dần theo từng năm, ngoại trừ cột màu cam.
– Cột màu đỏ ‘handled games’ luôn giữ vị trí cao nhất với độ dài ít nhất là gấp đôi so với các cột khác
Do đó đoạn ‘Overview’ được viết như sau:
“It is clear that sales of games for three out of the four platforms rose each year, leading to a significant rise in total global turnover over the 7-year period. Sales figures for handheld games were at least twice as high as those for any other platform in almost every year.”
NGUYỄN HOÀNG PHƯƠNG TRÂM VÀ CON ĐƯỜNG CHINH PHỤC IELTS 4.5 TRONG 3 THÁNG |
LỘ TRÌNH HỌC IELTS TỪ CON SỐ 0 ĐẾN 5.5 IELTS CỦA THÁI HOÀNG KIM NGÂN |
TRẦN NGỌC TRÚC LINH ĐẠT IELTS 6.5 SAU 2 THÁNG ÔN LUYỆN |
3.3. Body
Trong phần này các bạn sẽ viết chi tiết về các đặc điểm nổi bật mà mình thấy trên biểu đồ dựa vào gợi ý dưới đây. Mỗi đoạn nên bao gồm 3 – 4 câu.
Gợi ý phân tích kỹ biểu đồ:
- Tìm ra các điểm cao nhất/dài nhất, thấp nhất/ngắn nhất, tìm những điểm/hình mẫu chung và khác biệt đối với các cột trong biểu đồ.
- Tập trung vào màu sắc và độ dài của các thanh để đưa ra so sánh trước.
- Nên xem kỹ từng thành phần một trước khi xem biểu đồ một cách tổng thể.
- Xác định những điểm/mẫu chung của các cột/thanh để nhóm thông tin cho cấu trúc bài viết.
Ví dụ : A survey conducted for the places in which people gain access to the internet from 1998 to 2004
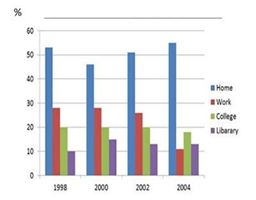
Khổ 1: So sánh phần trăm sử dụng internet ở các địa điểm trong năm 1998.
Khổ 2: So sánh sự thay đổi của chúng từ năm 1998 đến 2004. Trong khoảng thời gian này nếu có điểm gì đặc biệt. VD chúng lên đến điểm cao nhất hoặc rơi xuống điểm thấp nhất cũng nên thêm vào nếu có đủ thời gian.
“In 1998, the proportion of users accessing the Internet from home was the highest, at around 54%. By contrast, the rate for those who used it at the library was at the lowest point of exactly 10%. Approximately 27% of users connected to the Internet at work, compared to precisely 20% at college.
The percentage of Internet users gaining access from their houses rose to approximately 55% in 2004, after a decline of about 8% in 2000. On the other hand, the figures for access at work and college decreased to exactly 10% and around 18%, respectively, over the period. Users accessing the Internet at the library increased about 5% from 1998 to 2000 and then dipped slightly in 2002, where it remained steady throughout 2004.”
Hi vọng những bí quyết luyện thi phần writing sẽ giúp bạn làm bài thi đạt kết quả tốt nhất!
Xem thêm
BÍ QUYẾT LUYỆN THI IELTS WRITING TASK 1 (PHẦN 3)
BÍ QUYẾT THÀNH CÔNG VỚI IELTS
CÁC MẸO LUYỆN THI TOEIC NHẤT ĐỊNH PHẢI BIẾT
KHÓA LUYỆN THI SAT CẤP TỐC 2018
Đăng ký khóa học IELTS và được tư vấn về khóa học IELTS tại đây:
TRUNG TÂM ANH NGỮ - TIN HỌC ISEC
Địa chỉ: 50 Hàm Nghi - Phường Thanh Khê - Quận Hải Châu - Tp. Đà Nẵng
Hotline :(0236)3702 150/ 0935.667.179
Bạn chắc hẳn không thể bỏ qua các bài viết này!


